
Surveys tell you what business owners say they plan to do. Spending tells you what they actually did. Every day, thousands of UAE businesses pay their suppliers, software, fuel, visas and ad campaigns with Pemo cards. That gives us an unusually clear view of where SME money goes, and how it shifts from one quarter to the next.
The Pemo SME Spend Index turns that view into a regular report. It is built on nearly 3.5 million anonymised card transactions worth nearly AED 2bn between October 2025 and September 2026. We will publish it every quarter, with the same method each time, so each edition can be read against the last.
This first edition covers Q3 2026 (July to September). Below are the main findings, the data behind them, and an explanation of exactly how the index works.
Q3 2026 at a glance
AI has become a budget line
In Q3 2026, 29% of businesses that used their Pemo cards paid for at least one AI tool. Measured month by month, the share has more than doubled in two years, from 12% in Oct 2024 to 27% in Sep 2026, and the climb steepened in 2026.
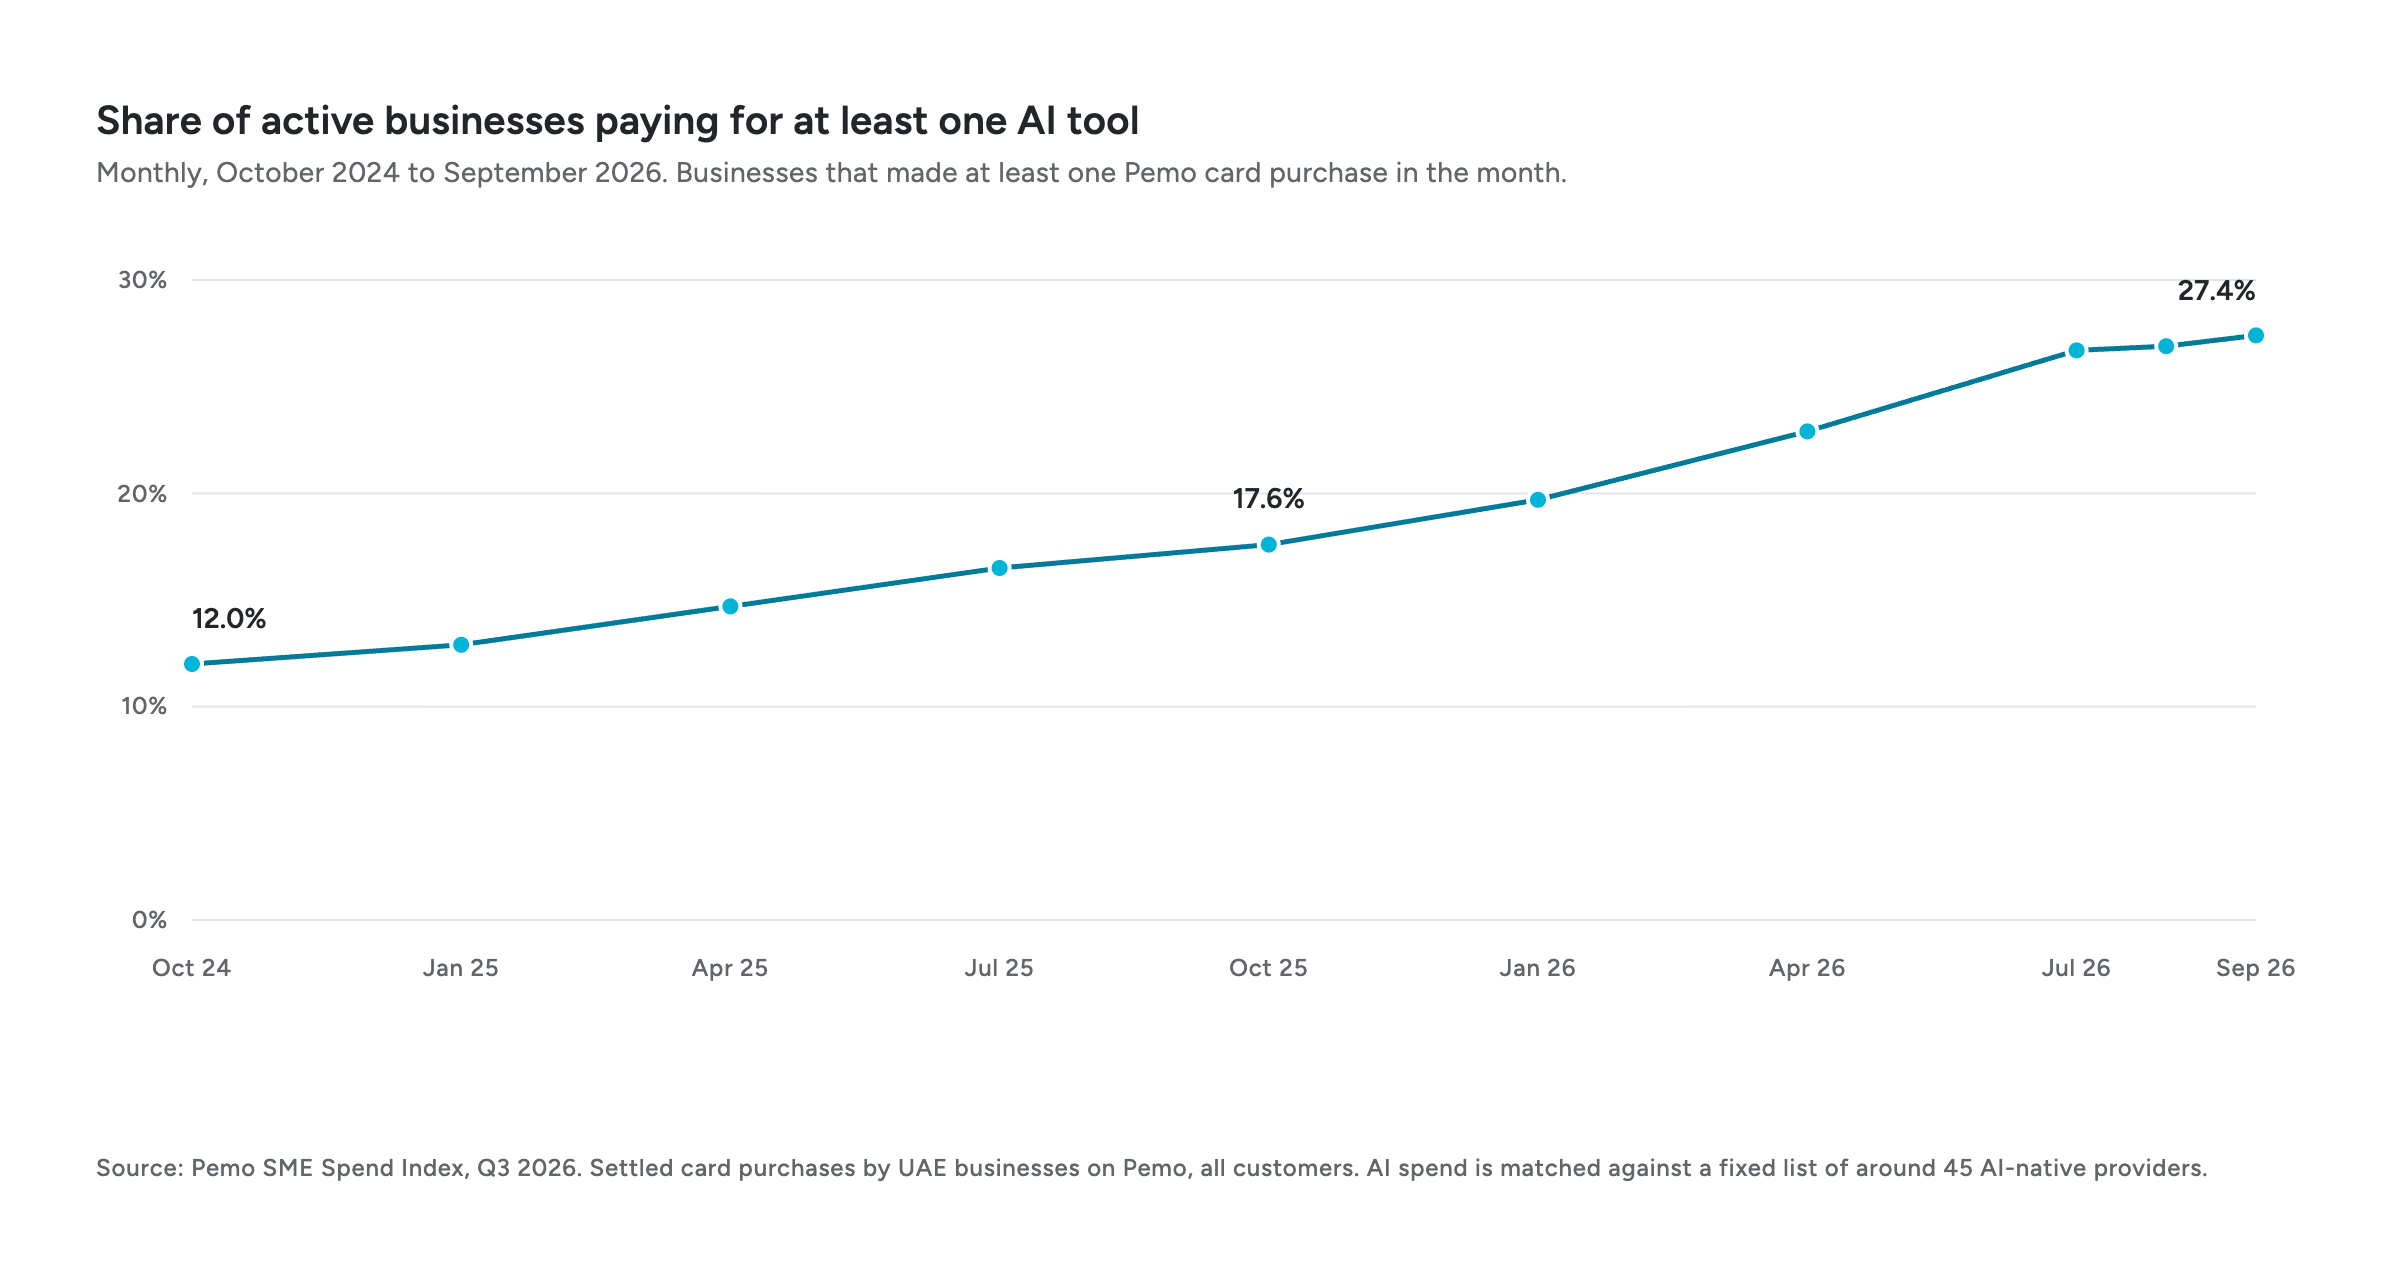
Total AI spend across Pemo's business customers was five times higher than in Q3 2025. Part of that comes from more businesses joining Pemo, so we also look at the same businesses in both years. On that like-for-like basis, AI spend rose more than fourfold and the share paying for AI went from 21% to 35%.
Most businesses are not spending large sums yet. The typical business paying for AI spent AED 268 a month, roughly one or two paid seats. AI is still only 1% of total card spend. But it reaches far more businesses than that number suggests: more businesses paid for AI tools (29%) than for hotel stays (17%) or flights (16%).
Where the money is going
To see what is rising and falling, we compare only businesses that were active in both Q3 2025 and Q3 2026. Their total card spend grew 9%. Some categories grew much faster, and some went backwards.
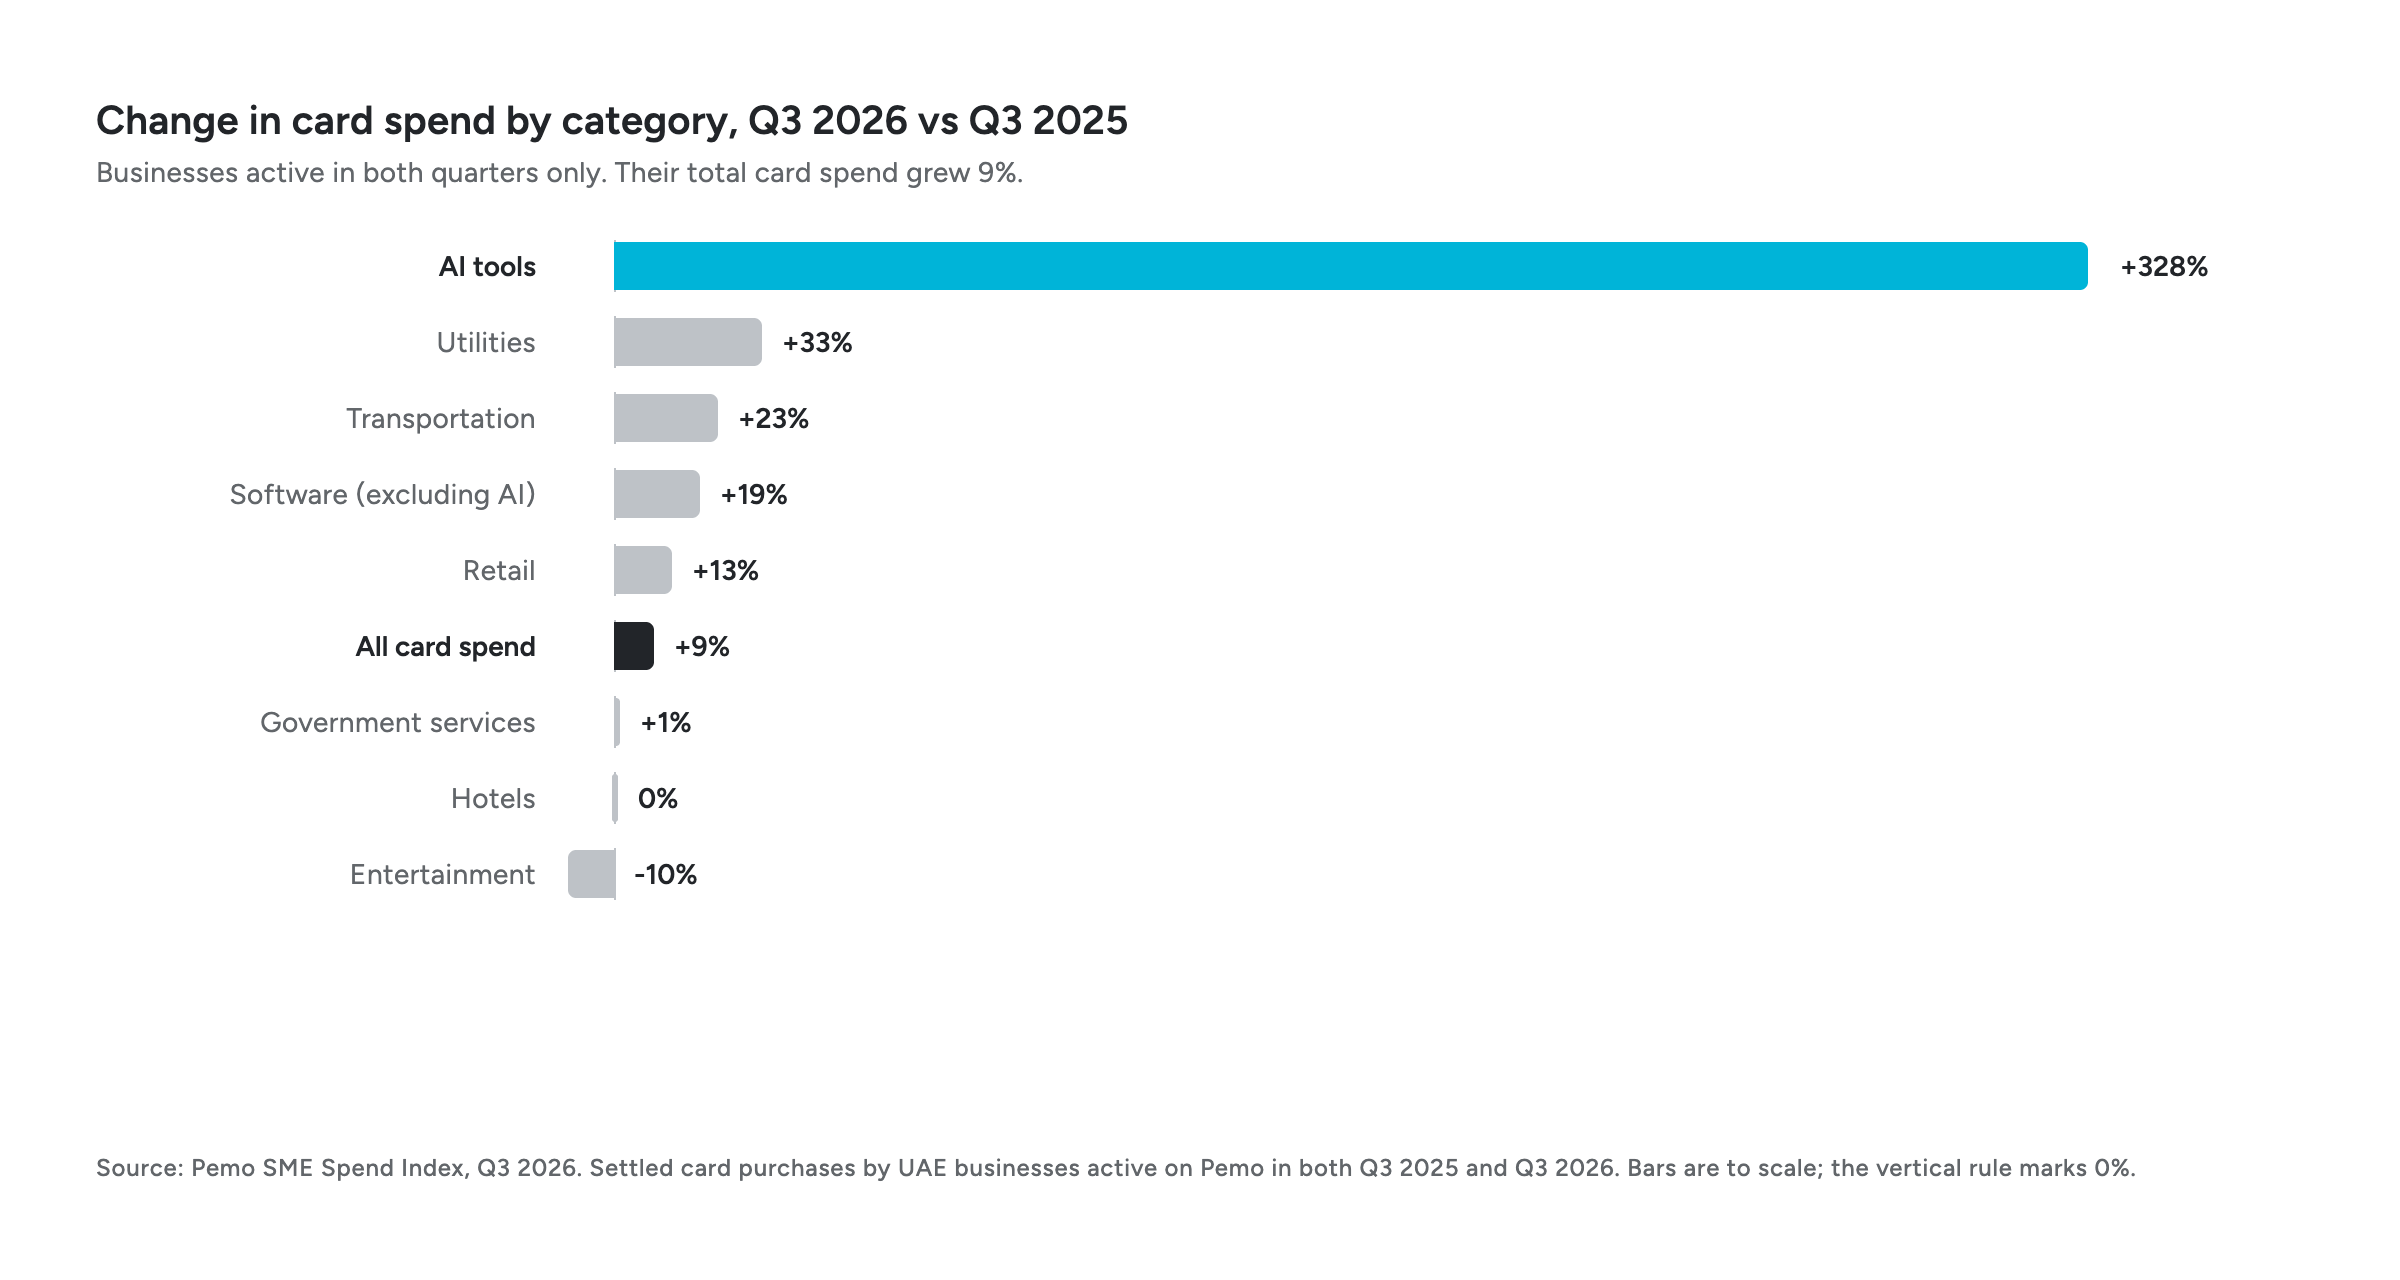
Government services remain the largest single item in the SME wallet, at more than a third of card spend. Visas, licences, permits and fees are a fixed cost of doing business in the UAE, and nearly three in four businesses paid at least one on a Pemo card in the quarter.
Sector by sector
AI adoption is highest where you would expect it, but it is spreading well beyond tech.
"Most used" is the provider paid by the most businesses in the sector. "Level" means the two leading providers are within 10% of each other.
Half of technology companies pay for AI, and the typical one spends AED 880 a month, the highest of any sector. Marketing agencies are close behind on adoption, and they put the largest share of their budget into AI: 6% of their card spend, against 5% for technology companies. In every other sector, AI is less than 2% of card spend.
More traditional industries are following. Almost four in ten real estate firms and more than a third of professional services firms now pay for AI. Construction and hospitality are earlier in the journey, with around one in six businesses paying for AI tools.
The wider wallet looks very different from sector to sector. Healthcare clinics spend more on advertising than on anything else, 30% of their card spend. Real estate firms put a larger share into utilities (17%) than any other sector. Logistics and professional services firms put more than half their card spend into government fees.
Which AI tools businesses pay for
Anthropic, the company behind Claude, and OpenAI, the maker of ChatGPT, are closely matched. Anthropic is paid by the most businesses in technology, real estate and professional services. OpenAI leads in media, events, healthcare and construction. In several sectors the two are level.
By spend, the picture is clearer. Anthropic is the largest AI provider by spend in most sectors, because businesses that pay for it spend about twice as much on it, on average, as OpenAI customers spend on OpenAI. Beyond the two leaders, businesses are paying for AI coding tools such as Cursor and AI video tools such as Higgsfield, both of which grew quickly over the year.
How the Pemo SME Spend Index works
A spending index is only useful if people can trust how it is built. Here is exactly what goes into it, and what it can and cannot tell you.
The data
The index uses settled card purchases made by businesses on Pemo. Settled means the payment has gone through. Declined, cancelled and refunded payments, wallet top-ups and fees are left out. Between October 2025 and September 2026 that is nearly 3.5 million transactions worth nearly AED 2bn. Quarterly figures cover every business that made at least one card purchase in the quarter.
Categories
Every card payment carries a merchant category code from the card network. We map these codes into everyday categories such as utilities, fuel, advertising, software and government services.
How we identify AI spend
Card networks do not have a category for AI, so we built one. We keep a fixed list of around 45 AI-native providers, including Anthropic, OpenAI, Cursor, Midjourney, ElevenLabs and others, and match payments on the merchant name. AI that comes bundled inside larger software suites, such as Microsoft or Google, is not counted. Free tools and personal subscriptions do not appear either. That means the index understates total AI use, and we prefer to undercount rather than guess.
Comparing like with like
Pemo's customer base grows every quarter. If we simply compared all businesses this year with all businesses last year, some of the change would come from new customers rather than from changing behaviour. So for rising and falling categories, we compare only businesses that were active in both periods. We show total AI spend across all customers as well, and we always state which basis a figure uses.
Typical spend, not averages
A handful of heavy users can pull an average a long way from what most businesses spend. Our "typical" figures are medians: half of businesses spend more, half spend less.
Privacy and publishing rules
All data is anonymised and aggregated. We never publish anything about an individual business. We show a sector only when at least 100 businesses in it were active in the quarter, and AI figures for a sector only when at least 30 of them paid for AI. We do not publish any figure where a single business accounts for more than 25% of it.
What the index is not
The index reflects what Pemo customers spend on Pemo cards. Pemo customers are not a representative sample of all UAE SMEs, and businesses may also spend through other cards, bank transfers or cash. A fall in a category can mean less spending, or spending that moved off Pemo cards. We read the numbers with that in mind, and so should you.
What comes next
We will publish the Pemo SME Spend Index every quarter, using the same method, so each edition shows how SME spending is moving. The next edition, covering Q4 2026, is planned for January 2027, with sector editions alongside the main release.
If you are a journalist and want to use the data or speak to our team, contact Cheryl King at King & Co PR on cheryl@kingandcopr.com.
Want this level of visibility over your own business spending? Pemo gives growing UAE businesses corporate cards, bill payments and real-time spend control in one platform.


